
Research into litter and fly-tipping at carpool car parks

Between 2018 and 2020, Mooimakers and the Agency for Roads and Traffic (AWV) conducted some research into the effect of measures against litter and fly-tipping at carpool car parks. The research was conducted by the research agencies OWS and Statter.
Objective
The research aimed to see whether putting up information signs and removing rubbish bins had an impact on the amount of fly-tipping and littering. Based on baseline= and effect measurements, the impact could be weighed before and after the measures.
Measures & locations
For the research, the following measures were used at Agency for Roads and Traffic (AWV) carpool car parks and their impact was analysed:
-
Placing a warning sign against fly-tipping;
-
If the situation's condition is equal or worsening: removing the rubbish bins and placing a new information sign with the reason.
The research took place at the carpool car parks of Affligem, Hoegaarden, Paal-Beringen and Waasmunster.
Conduct of the research
Initially, a warning sign reading "THIS IS A LITTER BIN, NOT A HOUSEHOLD WASTE BIN" was placed above all rubbish bins at each carpool car park:

Warning sign placed above each rubbish bin at the start of the second phase of the study.
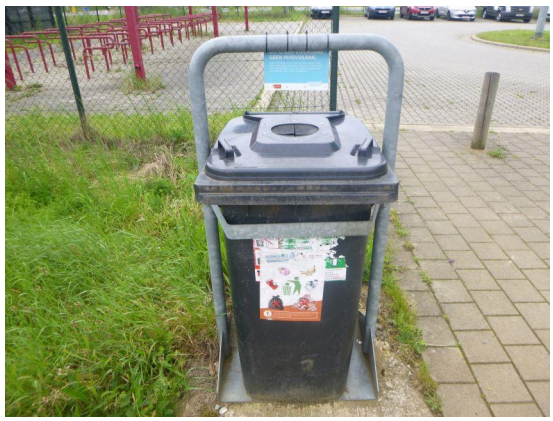
Warning sign placed above each rubbish bin at the start of the second phase of the study.
In the second instance, with the exception of the carpool car park in Waasmunster, all the rubbish bins were taken away and an information sign reading "REMOVED OWING TO ABUSE" was placed at each (empty) rubbish bin bracket:

Information sign placed at each rubbish bin bracket after rubbish bin removal at the start of the third phase of the study.
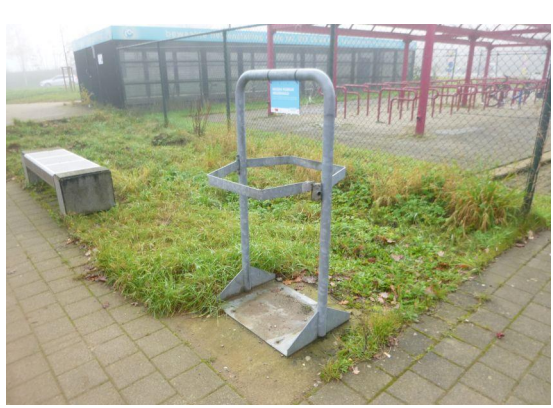
Information sign placed at each rubbish bin bracket at the carpool car parks in Affligem, Hoegaarden and Paal-Beringen after rubbish bin removal at the start of the third phase.
At the carpool car park in Waasmunster, only the warning signs were removed, but the rubbish bins remained, to test a variation of the measure.
Measurements
Three baseline measurements were taken at each carpool car park, three intervention measurements after the warning signs were placed, and three intervention measurements after the rubbish bins and/or warning sign were removed.
- The baseline measurements were conducted in the period January-March 2018 to collect baseline data around quantities (litter, fly-tipping, properly disposed rubbish in and around the rubbish bin)
- the first intervention measurements took place in the period April-September 2019 after the placement of the warning sign
- the second intervention measurements were conducted in the period November 2019-January 2020 after removing the rubbish bins and installing an information sign. At the Waasmunster car park, we measured the variation.
During the initial baseline measurement, a perimeter with a radius of a maximum of 2 metres was established for every rubbish bin individually. This surface area was subsequently maintained during all baseline and intervention measurements to follow. The following waste fractions were recorded at the carpool car parks:
Around the rubbish bin:
-
Number of cigarette butt items
-
Number of 'fresh' chewing gum items
-
Other litter (weight; kg)
-
Fly-tipping waste (weight; kg)
In the rubbish bin:
-
Properly disposed truckers' waste
-
Properly disposed waste
-
Fly-tipping litter
Results
The results show that the quantity of litter found around the rubbish bins at the different carpool car parks is very limited (measurements were only taken in a radius of maximum 2 metres around the rubbish bin). As a result, it is not possible to observe any positive or negative effect.
Despite a (very) large variance in the quantity of fly-tipping measured, the results do allow one to observe a trend:
-
The removal of the rubbish bins, combined with the placement of an information sign, causes a decrease in the total quantity of fly-tipping waste.
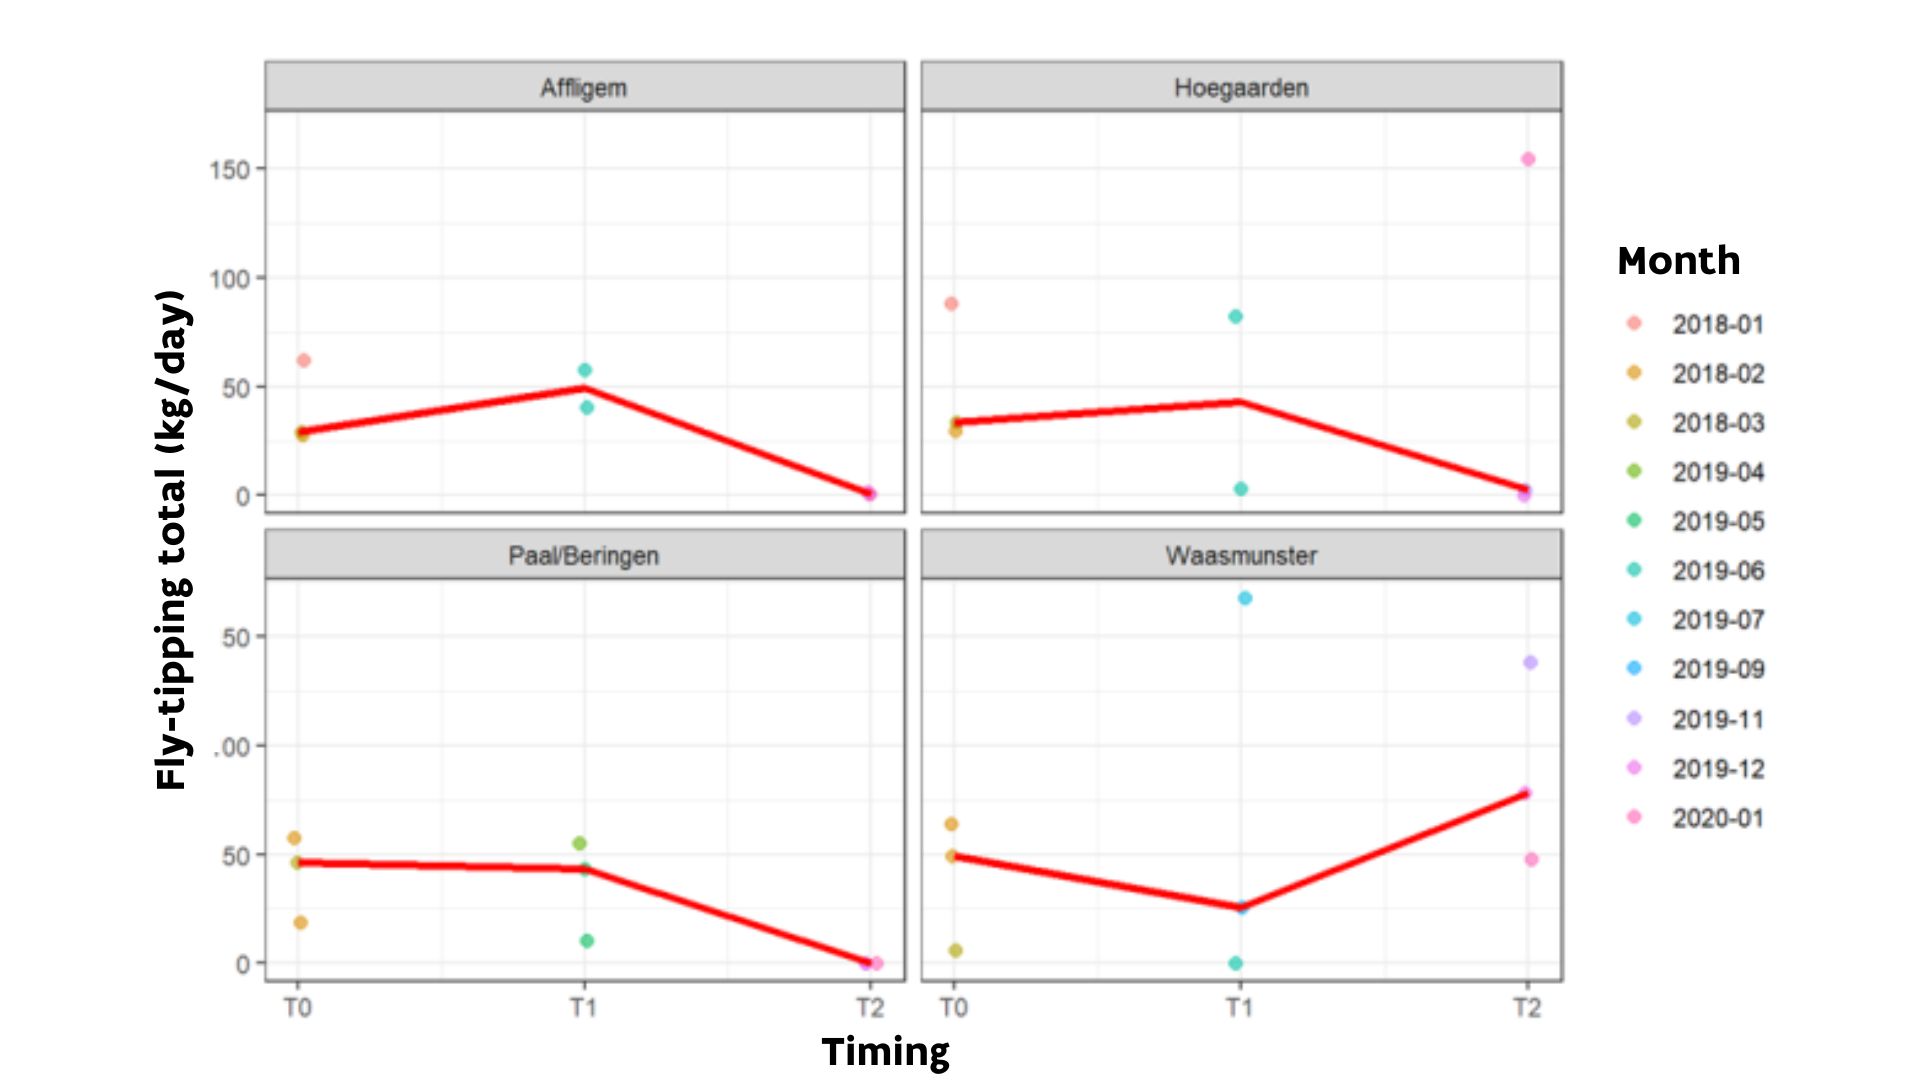
The total quantity of fly-tipping waste recorded at each carpool car park during baseline measurements (T0), first intervention measurements (T1) and second intervention measurements (T2). The red line is a trend line based on the median.
-
Retaining the rubbish bins, combined with the removal of the warning sign and the placement of an information sign, in turn potentially causes an increase in the total quantity of fly-tipping waste. However, this is not a strongly supported conclusion since these measures were only implemented at a single carpool car park (Waasmunster).
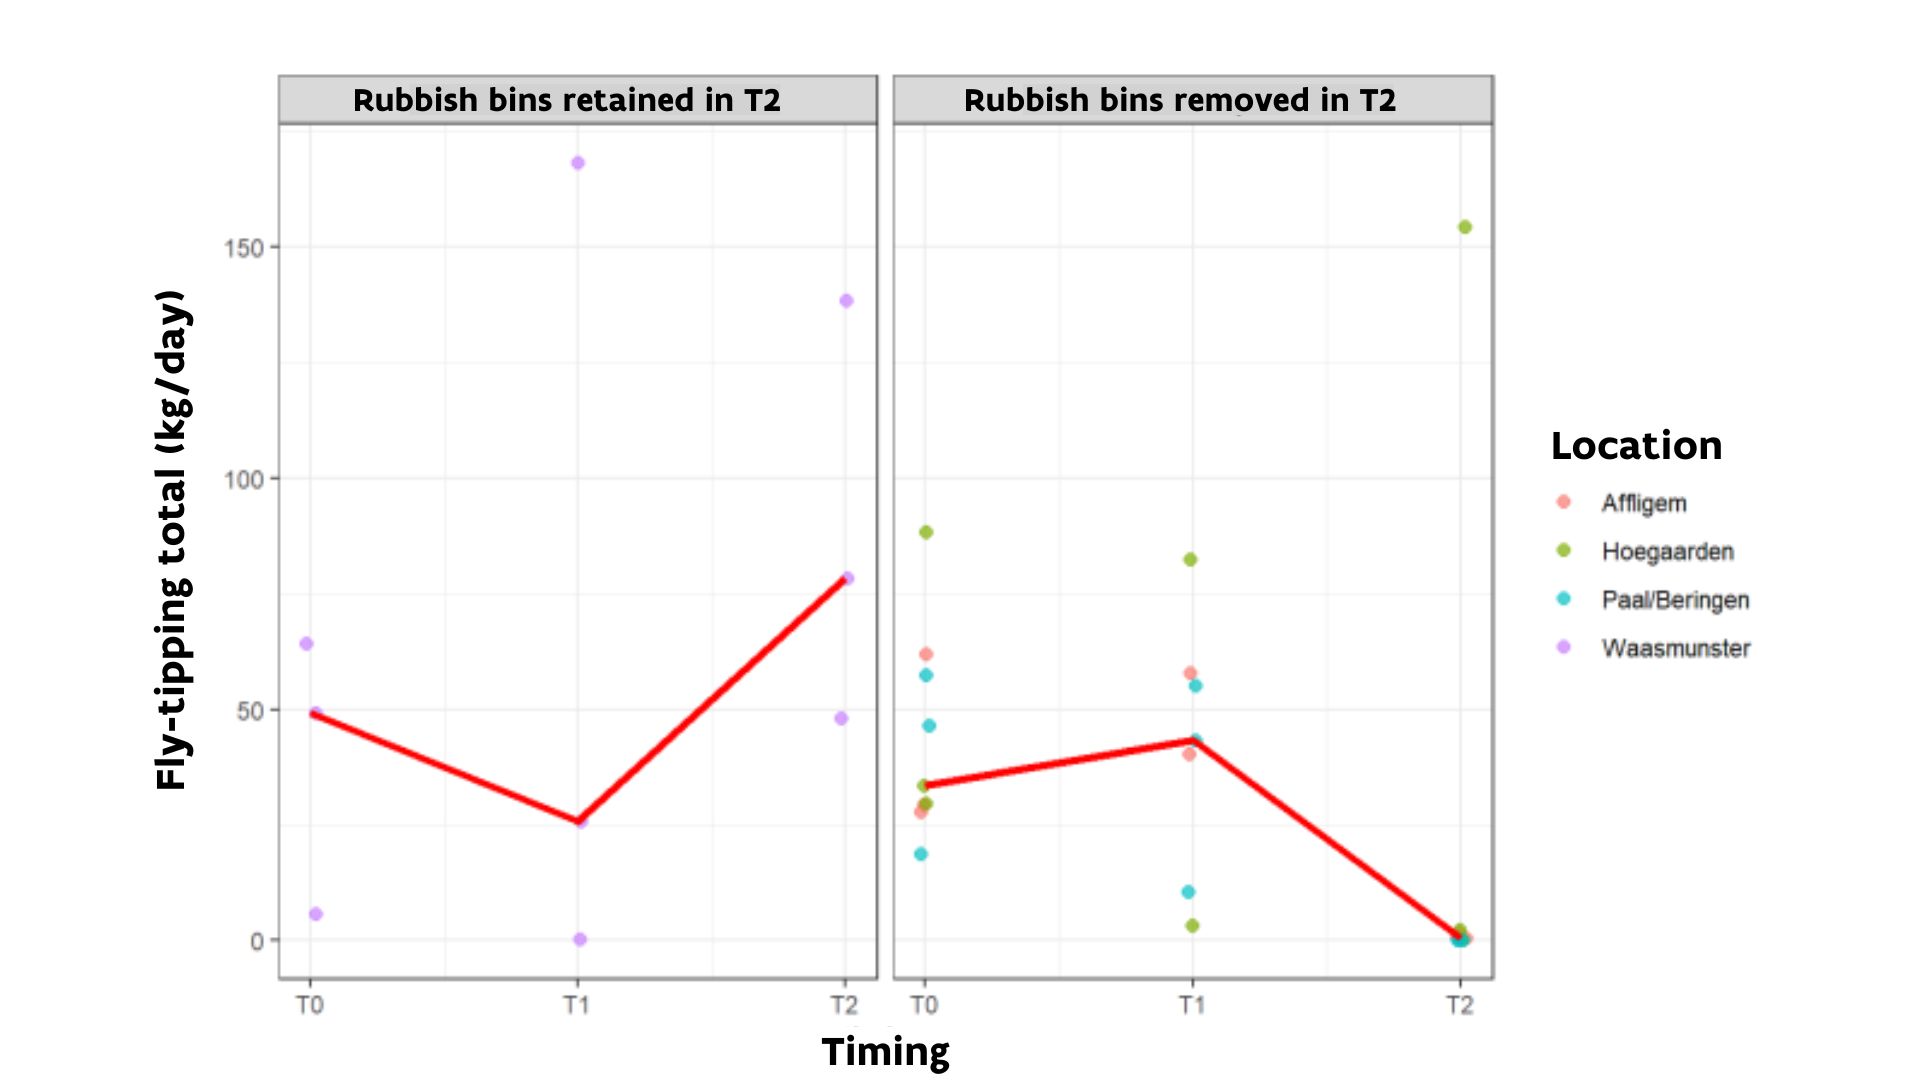
The total quantity of fly-tipping waste at carpool car parks where rubbish bins were removed versus carpool car parks where rubbish bins were not removed (Waasmunster). The red line is the trend line based on the median.
Conclusion
Overall, we conclude that the removal of rubbish bins at carpool car parks results in a decrease in the total amount of fly-tipping waste (this being within a perimeter with a radius of no more than 2 metres around the rubbish bin).
Finally, we can say that placing an information sign results in an increase in properly disposed waste in the rubbish bin, suggesting that the information sign encourages users to use the rubbish bin properly.